A new analysis of precinct-level data by the NBC News Decision Desk shows the extent to which President-elect Donald Trump’s wins in Michigan, Wisconsin, and Pennsylvania — and Vice President Kamala Harris’s losses — were driven by weak turnout in heavily Democratic cities.
Going into Election Day, Harris’s clearest path to victory was to win all three states in the old “blue wall.” Ultimately, she fell short in all three, and the nearly completed vote count in those states shows how the number of votes compared to 2020 dropped in some of the most Democratic-friendly areas of those states.
The charts below show the relationship between Harris’ share of the vote and the percent change in the total number of votes cast in the presidential race compared to the total vote in 2020. Each dot represents a county, and dots that are above the 0% line are counties with more voters in 2024 than 2020; the relatively few dots below that line are counties with fewer voters in 2024 compared to 2020.
As the diagonal black lines show, in all three states, heavily Democratic counties on the right side of each panel had worse turnout relative to 2020 than the heavily Republican counties on the left side. The largest county in each state — Wayne County, Michigan, home of Detroit; Philadelphia County, Pennsylvania; and Milwaukee County, Wisconsin — had either the worst or second-worst shift in votes cast of any county in their state.
These three underperforming counties and their cities fueled the Democratic electoral success in the 2020 and 2022 elections. Although Harris comfortably won all three of these cities by over 50 percentage points each, she received a slightly lower percentage of the vote than Joe Biden did in 2020. More consequential, however, was the stagnant or shrinking turnout in these cities, which — coupled with turnout growth in Republican counties across the blue wall — drove Trump’s victory.
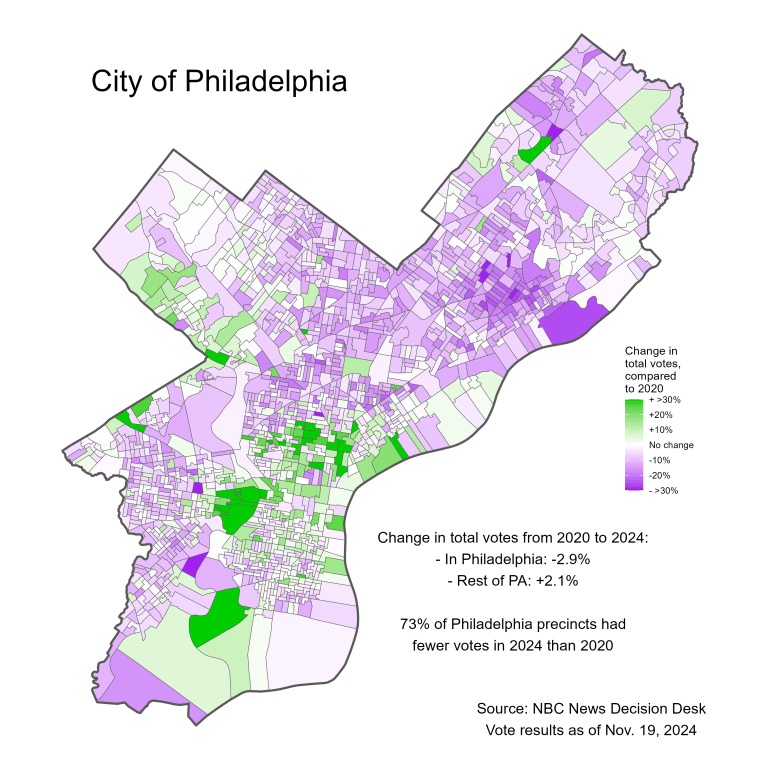
This map of Philadelphia highlights this shrinkage in turnout from 2020 to 2024. The purple parts of the map represent precincts where the total number of votes was smaller in 2024 than 2020, while the vote count increased in the green precincts.

Out of more than 1,700 precincts in Philadelphia, 73% had fewer voters in 2024 than in 2020. Overall, the total number of votes in Philadelphia decreased by 2.9% — resulting in approximately 20,000 fewer voters this year. Meanwhile, the rest of Pennsylvania saw a 2.1% increase in the total number of voters compared to 2020.
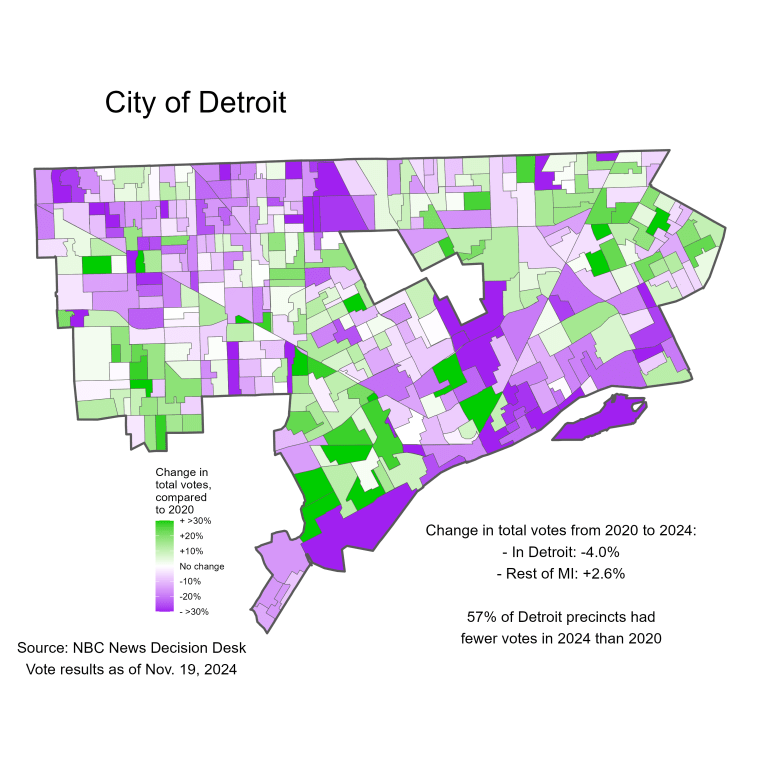
The next map shows turnout shifts in Detroit, which makes up about one-third of Wayne County’s population. Detroit had an even more extreme drop-off in turnout than Philadelphia’s. While the number of voters throughout the rest of Michigan grew by 2.6%, the number in Detroit fell by 4%.

Across the precincts in the northern part of Detroit, where voters are predominantly Black, the total number of votes tended to be more down than up. Even though Harris received nearly as much support from Black voters in Michigan as Biden — 89% versus 92%, respectively, according to the NBC News Exit Poll — diminished turnout in these precincts meant that for every 10 voters who did not participate, Harris was losing nine votes while Trump was losing only one.
This overall decrease in Detroit’s turnout would have been even more dramatic had it not been for increased turnout in the Latino neighborhoods in the central-southern part of the city. This turnout growth, however, may not have worked in Harris’ favor. According to the NBC News Exit Poll, Trump carried the Latino vote in Michigan in 2024, while Joe Biden won a majority of that group in 2020.

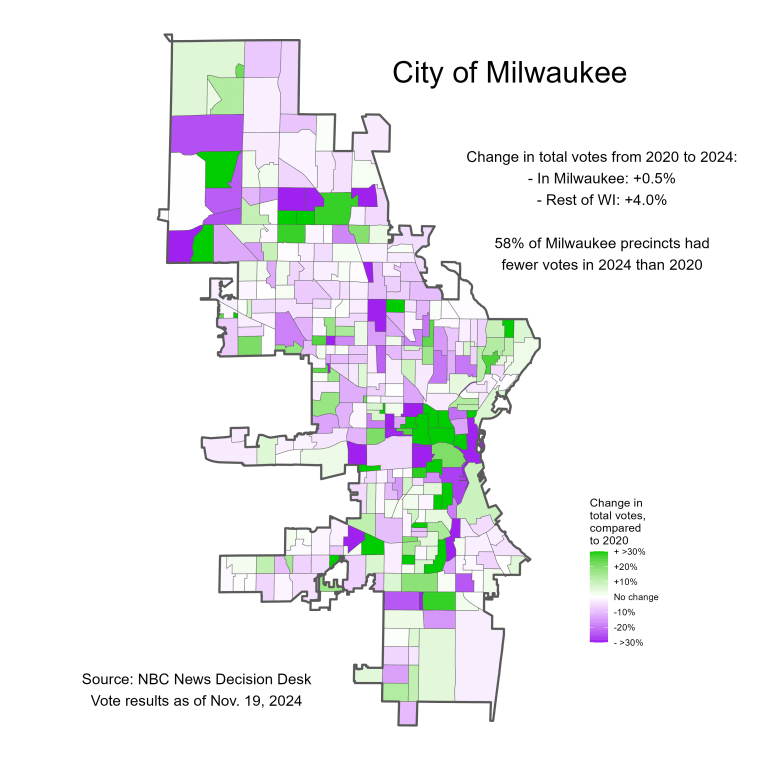
The third large blue wall city is Milwaukee, which makes up about 60% of Milwaukee County’s population. Unlike Philadelphia and Detroit, the number of votes cast in the city of Milwaukee actually increased slightly since 2020, by about half a percentage point. But in the rest of Wisconsin, the number of voters grew 4% compared to 2020.
The map of Milwaukee precincts show a patchwork of increased and decreased turnout. Even though turnout grew slightly overall in the city, just over half of precincts (58%) experienced a turnout decrease. Comparing Milwaukee’s sluggish turnout to Dane County — which is Wisconsin’s other large Democratic county, where turnout increased by over 6% — helps to show how different demographics may explain turnout changes. While both the city of Milwaukee and Dane County cast roughly three-quarters of their votes for Harris, they have dramatically different demographics.
The biggest difference between Milwaukee and Dane is that the city of Milwaukee’s population has been declining over the past few years, while Dane County’s has grown rapidly. If Milwaukee’s pattern of population decline — which also occurred in Philadelphia and Detroit — continues, Democratic candidates will have to rely more heavily on voters outside of those cities to win statewide elections.
There are other important demographic differences between Milwaukee and Dane County. About 35% of Milwaukee’s residents are white and non-Hispanic. Dane County, on the other hand, has a population that is about 84% non-Hispanic white. Furthermore, about a quarter of Milwaukee’s residents have a college degree, compared to over half of people in Dane County.
This difference is notable, given that Wisconsin voters with a college degree in the NBC News Exit Poll were one of the only demographic groups in which Harris improved on Joe Biden’s 2020 vote results.


